To improve processes, it is important to map them first. A popular tool used for this purpose is the Value Stream Map, also known as the value stream analysis. It can be used to analyse the stream (flow) of products, services and information so that improvements can subsequently be implemented.
The value stream is a collection of activities that is required to produce a product or service and eventually deliver it to the customer. During the value stream analysis, activities that add value to processes are separated from activities that cause wastes. This provides a clear overview of the entire process and indicates where improvements can be made to encourage better flow.
Value-Added Flow Chart
The Value-Added Flow Chart is used to improve runtimes and productivity by dividing process activities into ‘value-adding’ and ‘wastes’. It is important for the process to be visually represented in order to create a clear overview. Creating or interpreting a Value-Added Flow Chart is very simple.
- Place all process steps in order from start to finish.
- Create a diagram with every step in its own box.
- Calculate the time necessary for every step and add this to the boxes.
- Add together the times for every step and you will have calculated the total runtime.
- Determine which steps do not add any value to the process.
- Place the steps that do not add any value to the right of the steps that do add value.
- Analyse both sides and determine which activities can be improved in order to shorten the total process runtime.
- Visualise the adjusted process and keep improving it.
However, this is just one part of the Value Stream Map. While the Value-Added Flow Chart helps when it comes to identifying improvement opportunities, the Value Stream Map goes one step further.
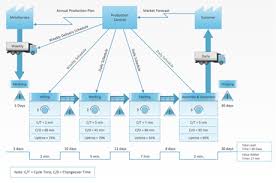
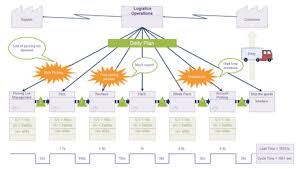
Value Stream Map
The Value-Added Flow Chart reflects the current state of the process, focusing primarily on a specific level (e.g. a single process). In the Value Stream Mapping process, this would be similar to the ‘Current State’. But because the Value Stream Map reflects the overall process at a general level and therefore contains much more information than a flow diagram (consider stock, staff involved and transport), it is better to view the Current State map as an extended version of a Value-Added Flow Chart. In addition to this, multiple processes are often necessary to develop the end product reflected in the Value Stream Map.
Once the current state has been put into perspective, a ‘Future-State Map’ is created. The name says it all. This is a future representation of the process – or – of the desired state. By comparing this to the Current State map, suggestions for improvement can be devised in order to achieve the desired state. These results eventually form part of an improvement schedule with a timeframe. Please note: the desired state will not be achieved overnight. This too is a process of constant adjustment and improvement.
The below images demonstrate what a Value Stream Map may look like.